I have been self-hosting for almost two three years now, and one thing I have never quite figured out is how to monitor all the applications I host. At this stage, there are approximately forty running Docker containers so I really should have some means of monitoring what's going on on them and the general health of the server they are running on. Professionally, I have used Splunk and Sumo Logic for monitoring services, but the open source solution I would prefer to use for this is Grafana. I have already set up Grafana to get logs from the Via app, and it seems to be a very widely used tool industry-wide, so it would be nice to not be completely in the dark on it! In particular, I will be using Loki, Prometheus, Promtail, Node-Exporter, and cAdvisor. As I have basically no experience with any of these tools, I will summarize my research on them for you, and document how they interact with each other in my setup. After that, I will describe which data I wish to collect and for what purpose, before finally showing the dashboards/alerts I have made. Let's go!
The Tools
Grafana
Lets start with the main one - what is Grafana? Grafana is at its core a web-based data visualization platform. It acts as a front end to many time-series databases, and uses plugins to consume data from different sources and support custom dashboard visualizations. It also has a simple graphical tool to help you craft queries on the data. The best place to try the Grafana platform out is at play.grafana.org.
Prometheus
Prometheus is a time-series database which operates on a pull model. You configure exporters which will have metrics requested from them by Prometheus on a regular schedule. There is a suite of components it can make use of, but one core feature we will be using is PromQL - the Prometheus Query Language. We will use this through Grafana to aggregate metrics collected by Prometheus. One thing that is important to note is that Prometheus is designed to work with numeric information only. This means it cannot be used to search through textual logs like you might do in Splunk or Sumo Logic.
Loki
Being restricted to just working with metrics is quite a limitation, so we will also be using Loki. Loki encompasses a set of tools/services, but my working model of it doesn't extend much further than Prometheus for log lines. It accepts data in any format, and similar to Prometheus, it allows you to build metrics and alerts based on them.
Promtail
Promtail is responsible for delivering log lines from log files to Loki. It is the roughly equivalent component in the Loki stack as Node-Exporter is in the Prometheus stack. This is confusing as Promtail looks like it should be part of the Prometheus stack, but alas naming of open source tooling is never great!
Promtail will be used to collect log lines from containers of my own services, or of services being debugged.
Node-Exporter
Node Exporter monitors and exports hardware and kernel level metrics to Prometheus. It is highly configurable with a long list of metrics it can collect if you desire. Despite the warnings, we will be running node-exporter from a Docker container for now. This is just for ease of encapsulation until I can move my personal home server to using NixOS or similar.
This will provide the host-level metrics we need, such as CPU usage, RAM usage, free space, etc.
cAdvisor
From the cAdvisor Github page:
[cAdvisor] is a running daemon that collects, aggregates, processes, and exports information about running containers.
These metrics can be exposed for Prometheus, and will provide the per-container resource usage metrics we need.
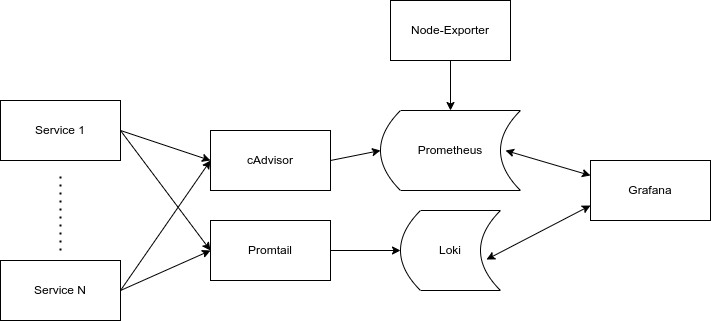
Stack
So now we have all the components explained, it's worthwhile visualizing the stack we will have. One crucial thing to remember is that while this seems like a large number of services, each one is very small and modular, so it won't be consuming a huge amount of resources.
The Data
Now we know the how of observability, we need to get to the what. Honestly, I spent a long time putting this off, probably because this was the largest gap in my knowledge! However, I think an iterative approach works best here anyways - both in iteratively building up to "complete" observability/insight, and iteratively building up my knowledge of the Grafana stack.
I suppose it makes sense to think about why I'm making some monitoring on these services. Primarily it's to see what my server is capable of. i.e. do I need to add some RAM/storage/replace the entire CPU? How many additional containers can I run? Has there been a large spike in usage? If so by what containers/services? How much network input/output is each service going through? As a percentage of the whole input/output? How much storage is each container using? Secondly, I want to have insights into actual logs of my own services (or for others if I really want I guess? But primarily my homemade services). This should be all logs for debug purposes and usage metrics in general.
Lets make a list:
- Host
- Metrics
- CPU Usage
- RAM Usage
- Storage Usage %
- Load (1 min, 5 min, 15 min seems standard)
- Network Throughput (Input/Output volume)
- Logs
- syslog
- auth.log
- Metrics
- Per-Service
- Metrics
- CPU Usage %
- RAM Usage
- Storage Usage %
- Network Throughput
- Logs
- For specific containers
- Metrics
The Implementation
Now we know what we're observing, and how we're going to ingest it, we just need to do it!
Since we painstakingly mapped out the different component services, we can tell instantly that we need cAdvisor for the per-service metrics, NodeExporter for the host metrics, and loki for all the log lines. Lets start with the metrics.
The metrics all need to feed into prometheus in order to end up in Grafana, so we need to edit the prometheus config file in order to do that. For getting all our container metrics from cAdvisor, we just need a few lines. For NodeExporter, just a few more:
scrape_configs:
  - job_name: "cadvisor"
    scrape_interval: 15s
    static_configs:
      - targets: ["cadvisor:8080"]
  - job_name: "node_exporter"
    scrape_interval: 15s
    static_configs:
      - targets: ["node-exporter:9100"]
Then Loki needs to be configured for syslog and auth.log. This was achieved by a simple promtail config and mapping /var/log:/var/log/host_logs in docker-compose:
scrape_configs:
- job_name: hostlogs_job
  static_configs:
  - targets:
      - localhost
    labels:
      job: hostlogs
      __path__: /var/hostlogs/*log
- job_name: docker_container_logs
  docker_sd_configs:
  - host: unix:///var/run/docker.sock
    refresh_interval: 5s
  relabel_configs:
    - source_labels: ['__meta_docker_container_name']
      regex: '/(.*)'
      target_label: 'container'
Alerting
Finally we have the full stack set up. Last remaining thing to get a semi-professional (emphasis on the semi!) is to get some alerting going. For alerting, I'm going to use ntfy and a small Grafana integration I found called grafana-to-ntfy. This took a little more work than expected, but eventually I got it all working. Firstly, I set up a personal ntfy instance, then added the grafana-ntfy container to my docker-compose along with a simple env file as explained in the README. I then integrated it with Grafana alerting. One of the key things to note here is that I just used plain http for communication with the grafana-ntfy container as I couldn't get it set up with SSL! I kept getting invalid cert errors with reference to a cert only valid for Traefik. Also not fully documented, but the BAUTH variables need to be passed too although they should be made optional. May submit a PR for that... Follow the README to do a test notification
Set up a query to make sure notifications are coming through and then just get on with standard alarming!
Conclusion
So, as you've probably realized, I really lost steam towards the end of this post. I have been working on this post/stack setup for about three months and it has been frustrating me to no end and stopping me from writing things I would prefer to write about, and follow my current tech interests. I try to balance doing things I feel I should do with things that I have a strong (but usually fleeting) motivation to do as these rarely overlap. This time however, even though I can see the huge benefit of having a well set up monitoring stack for my home server and how all aspects of this will improve my quality of life when debugging/doing basic admin, the balance has just tipped to being more stressful than beneficial to me.
I will update my stack in the future, and hopefully write a more concise post on setting up a home server monitoring stack, but for now, this is all you get!