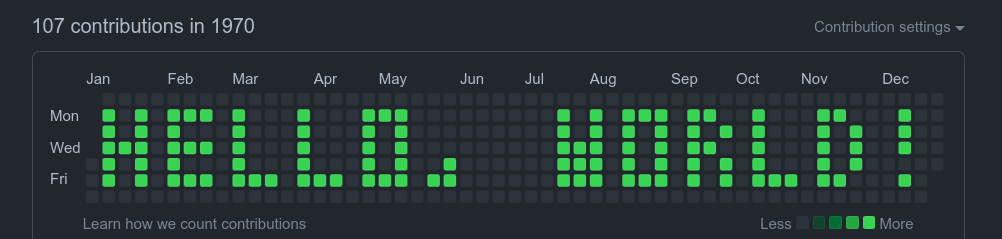
I've thought for a while now that the Github contributions heatmap is a particularly uninteresting page. This thought popped into my head once more after reading a fantastic ebook on the fundamentals of Git, so armed with new confidence and knowledge of Git commits, I decided to fake contributions on my profile in order to spell out words on my heatmap.
I knew that the contributions chart responded to commits in a Git repo, along with issues, pull requests, and other Github specific interactions. The commits seemed to be the easiest to fake (although I am a big fan of the relatively new Github CLI), so I found where dates are considered in a commit object and tried faking them to see if Github would accept them. The only two places I could see were the author date and the commit date. Faking the committer date was a simple matter of prepending the git commit command with an env variable GIT_COMMITTER_DATE. Changing the author date was even easier as git commit accepts a --date argument! So making a commit for a specific date came up to be:
$ LC_ALL=C GIT_COMMITTER_DATE="$(date --date='01/01/1970 12:00')" git commit -a -m"01/01/1970 12:00" --no-edit --date "$(date --date='01/01/1970 12:00')"
Running this will give you a commit from 01/01/1970 which unsurprisingly is the earliest date you can have a commit on. We're not stopping there though, even though it is funny how the UI is broken on your profile page after doing that.

Now with a basis to build on, I decided to package this up into a simple Python script, and add some helper methods around it. Namely, being able to "draw" in a particular (x, y) position on the heatmap.
def get_origin_datetime(year):
    """
    Returns the datetime of (0,0) on the contributions heatmap.

    This is horrific code.
    """
    d = datetime.datetime(year, 1, 1, 12)

    while d.weekday() != 6:
        d += datetime.timedelta(1)

    return d


def xy_to_datetime(year, x, y):
    return get_origin_datetime(year) + datetime.timedelta((7 * x) + y)
Then I used a handy Dot Matrix Tool to create a font which was 3x5 pixels, and translated each character into a simple template:
    's': [
        (0, 0), (1, 0), (2, 0),
        (0, 1),
        (0, 2), (1, 2), (2, 2),
                        (2, 3),
        (0, 4), (1, 4), (2, 4),
    ],
With this done, there was only one method left to implement and we were good to go:
def draw_letter(year, letter, letter_number):
    """
    The letter_number is to calculate the offset to apply in the grid.
    """
    x_offset = letter_number * (LETTER_WIDTH + INTER_LETTER_SPACE_WIDTH)
    # This centres the letter vertically
    y_offset = 1

    for coord in LETTERS[letter]:
        commit_on_xy(year, x_offset + coord[0], y_offset + coord[1])
To view this more sensibly, check out this gist. The only improvement I'm thinking about at the minute is to include an opacity/darkness option on each pixel that is drawn to add a bit more detail to the lettering. But for a few hours on a Saturday morning, I'm happy with the result :)